If Stephen Cartwright ever lost his wallet he’d only have to glance at his LED-plotted photography to find out where he’s been the last 14 years. Since 1999, he’s recorded his exact longitude, latitude, and elevation at one-hour intervals. Using GPS, he even tracked himself while cycling more than 20,000 miles across the terrains of North America, Asia, and Europe. In 2013, pursuing the technical niche of past work, he decided to depict said coordinates by way of long exposure photography.
Advertisement
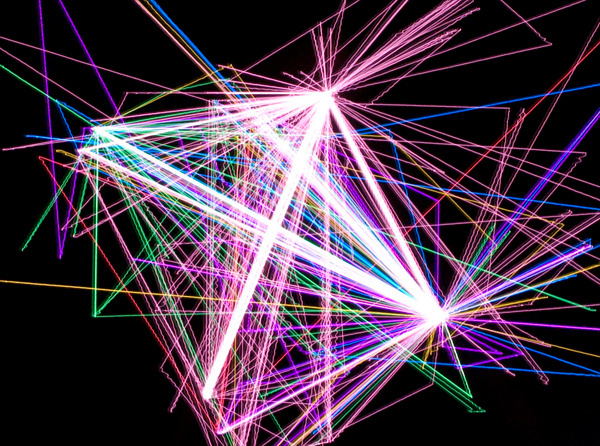
XY LED Plotter Image #3. 58x41x12in.The stunning gyroscopic images are achieved by using a device dubbed the XY LED Plotter. Programmed with an Arduino microprocessor, the machine powers an RGB LED across a panel in a similar, though not identical, fashion to how laser printers plot images on paper. But instead of company memos, Cartwright’s Plotter projects his GPS coordinates, as seen below.
Usually working with sculptures, the "XY Plotter" series is one of many Cartwright projects that combine “digital and traditional fabrication techniques, to translate… collected data.” The data can be collected from outside sources, as his 2030 piece depicts the glaciers and snow pockets found on Mt. Kenya.
2030. 4x4x6ft. Acrylic, stainless steelBut almost uniformly, Stephen works to document the data sets of his own life and history. With Deviation, the artist’s waking hours are compared to the time of sunrise using a colorful kinetic sculpture. Through basic movements, we see how the times he woke up (the green bars) differentiate with the times the sun rose (the blue bars) over the course of a year.
Working with associate Scott Burns, who usually handles the programming and technical aspects of his work, Cartwright’s moving sculpture works much like many apps on our smartphones do. Both provide easily digestible representations of data patterns―a function that will become increasingly more necessary as we struggle to ingest an ever-growing influx of information. For example, the human brain has the capacity to store 2.5 petabytes of binary data. One petabyte is equivalent to one quadrillion bytes, or units, of information. For comparison sake, the internet now holds 2.7 zettabytes. A zettabyte has six more zeros than a petabyte does. Just trying to understand the numbers is enough to overwhelm the average brain.
Advertisement
Cartwright, like so many of us, seems to have an express need to compartmentalize the ever-flowing data structures of his own life into works of art that are more easily consumed. Take Family Tree/Life Location. In this ongoing project, Stephen charts the course of his family history through various visual depictions that elicit patterns that a family heirloom might never.Through a video that looks like a city planning initiative for the movie Tron, Stephen maps the four-dimensional parameters of his family tree using a three-dimensional video interface.
As big data continues to carve itself a bigger role in our life, people will turn to the information patterns that make up their own plot of existence as a way to understand where they fit in this expanding universe of quantified experience. Most do it with YouTube, internet memes, infographics, or, even exercise apps. Stephen Cartwright prefers to do it with his art.@blacktiles
ONE EMAIL. ONE STORY. EVERY WEEK. SIGN UP FOR THE VICE NEWSLETTER.
By signing up, you agree to the Terms of Use and Privacy Policy & to receive electronic communications from Vice Media Group, which may include marketing promotions, advertisements and sponsored content.

 XY LED Plotter Image #3. 58x41x12in.The stunning gyroscopic images are achieved by using a device dubbed the XY LED Plotter. Programmed with an Arduino microprocessor, the machine powers an RGB LED across a panel in a similar, though not identical, fashion to how laser printers plot images on paper. But instead of company memos, Cartwright’s Plotter projects his GPS coordinates, as seen below.Usually working with sculptures, the "XY Plotter" series is one of many Cartwright projects that combine “digital and traditional fabrication techniques, to translate… collected data.” The data can be collected from outside sources, as his 2030 piece depicts the glaciers and snow pockets found on Mt. Kenya.